Debugging Model Context Protocol (MCP) Servers: Tips and Best Practices
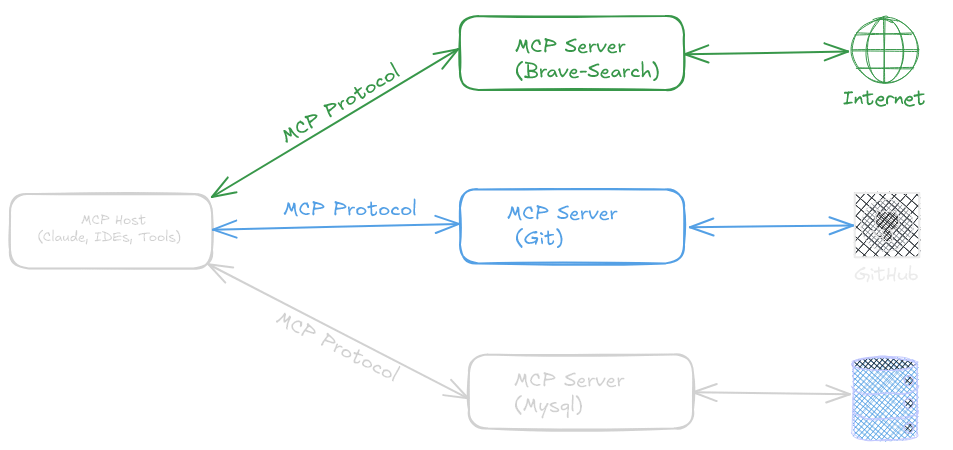
The Model Context Protocol (MCP) is an open JSON-RPC 2.0 standard enabling applications to expose data and tools to Large Language Model (LLM) hosts consistently. Architecturally, an MCP setup involves a host (the LLM application), one or more clients (connectors within the host), and servers that provide context (resources, tools, prompts). Think of MCP like "USB-C for AI": a standardized interface for integrating diverse data and tool sources.
Debugging MCP servers requires understanding this host-client-server interaction model, meticulously examining raw JSON-RPC messages, and correctly handling errors within your server implementation. This guide covers common issues and solutions for Node.js and Python MCP servers, providing practical examples.
 MCP Architecture: Host, Client, and Servers
MCP Architecture and Communication Flow
MCP utilizes JSON-RPC 2.0 messages exchanged over transports like standard I/O (stdio), HTTP, or Server-Sent Events (SSE). An MCP server registers:
- Resources: Read-only data endpoints.
- Tools: Functions or actions the LLM can invoke.
- Prompts: Pre-defined templates or instructions for the LLM, often simplifying tool usage.
When the host (e.g., Claude Desktop, Copilot Studio, or a custom LLM application) needs context, its client sends JSON-RPC requests (like initialize, getResource, runTool) to the appropriate server. The server processes these requests and sends back JSON-RPC responses.
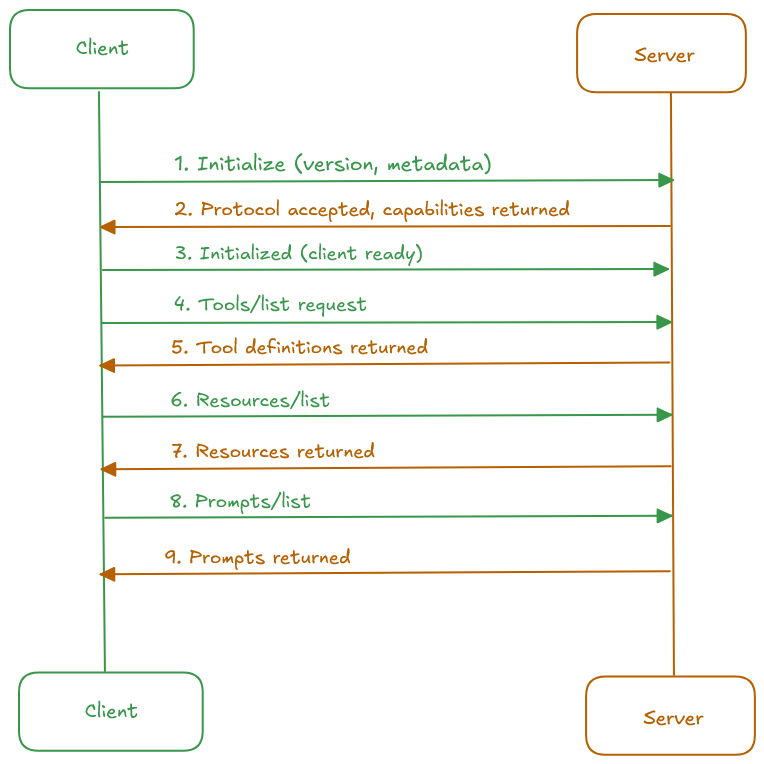
A critical initial step is the handshake, where the client and server negotiate a protocol version (formatted as YYYY-MM-DD). They must agree on a compatible version for the connection to proceed. Once initialized, the host can invoke the server's registered tools and resources repeatedly. Strict adherence to the MCP schema is essential for all communication.
Examining Raw Server Logs
Analyzing raw communication logs is fundamental to debugging. Below is a trace captured from a functioning MCP Fetch server, illustrating a typical session:
2025-05-02T09:35:23.552Z [fetch] [info] Initializing server...
2025-05-02T09:35:23.934Z [fetch] [info] Server started and connected successfully
2025-05-02T09:35:23.999Z [fetch] [info] Message from client: {"method":"initialize","params":{"protocolVersion":"2024-11-05","capabilities":{},"clientInfo":{"name":"claude-ai","version":"0.1.0"}},"jsonrpc":"2.0","id":0}
2025-05-02T09:35:33.280Z [fetch] [info] Message from server: {"jsonrpc":"2.0","id":0,"result":{"protocolVersion":"2024-11-05","capabilities":{"experimental":{},"prompts":{"listChanged":false},"tools":{"listChanged":false}},"serverInfo":{"name":"mcp-fetch","version":"1.2.0"}}}
2025-05-02T09:35:33.281Z [fetch] [info] Message from client: {"method":"notifications/initialized","jsonrpc":"2.0"}
2025-05-02T09:35:33.300Z [fetch] [info] Message from client: {"method":"tools/list","params":{},"jsonrpc":"2.0","id":1}
2025-05-02T09:35:33.314Z [fetch] [info] Message from client: {"method":"tools/list","params":{},"jsonrpc":"2.0","id":2}
2025-05-02T09:35:33.320Z [fetch] [info] Message from client: {"method":"resources/list","params":{},"jsonrpc":"2.0","id":3}
2025-05-02T09:35:33.329Z [fetch] [info] Message from server: {"jsonrpc":"2.0","id":1,"result":{"tools":[{"name":"fetch","description":"Fetches a URL and returns its content.","arguments":[{"name":"url","description":"The URL to fetch.","required":true,"type":"string"}],"result":{"type":"object"}}]}}
2025-05-02T09:35:33.334Z [fetch] [info] Message from server: {"jsonrpc":"2.0","id":2,"result":{"tools":[{"name":"fetch","description":"Fetches a URL and returns its content.","arguments":[{"name":"url","description":"The URL to fetch.","required":true,"type":"string"}],"result":{"type":"object"}}]}}
2025-05-02T09:35:33.335Z [fetch] [info] Message from server: {"jsonrpc":"2.0","id":3,"error":{"code":-32601,"message":"Method not found"}}
2025-05-02T09:35:33.379Z [fetch] [info] Message from client: {"method":"prompts/list","params":{},"jsonrpc":"2.0","id":4}
2025-05-02T09:35:33.387Z [fetch] [info] Message from server: {"jsonrpc":"2.0","id":4,"result":{"prompts":[{"name":"fetch","description":"Fetch a URL and extract its contents as markdown","arguments":[{"name":"url","description":"URL to fetch","required":true}]}]}}
Breakdown of the Communication Flow Example
 MCP Architecture: Host, Client, and Servers
-
Initialization Handshake:
- Client → Server: Sends
initializerequest with its desiredprotocolVersion(2024-11-05) and client info. - Server → Client: Responds confirming the
protocolVersion, declaring its capabilities (tools, prompts supported), and providing server info. - Note: A version mismatch here would terminate the connection.
- Client → Server: Sends
-
Initialization Confirmation:
- Client → Server: Sends
notifications/initializednotification, signaling it's ready for requests.
- Client → Server: Sends
-
Tool Discovery:
- Client → Server: Sends
tools/listrequests (twice in this log, possibly for redundancy or retry logic). - Server → Client: Responds with an array defining available tools. Here, it exposes a
fetchtool enabling web access. The schema defines arguments, descriptions, and validation constraints.
- Client → Server: Sends
-
Resource Listing (Optional):
- Client → Server: Sends
resources/listrequest. - Server → Client: Responds with JSON-RPC error
{"code":-32601,"message":"Method not found"}. This is the correct response if the server doesn't implement theresources/listmethod (i.e., exposes no resources).
- Client → Server: Sends
-
Prompt Listing:
- Client → Server: Sends
prompts/listrequest. - Server → Client: Responds with an array defining available prompts. Here, it exposes a
fetchprompt, providing a higher-level abstraction over thefetchtool for easier LLM interaction.
- Client → Server: Sends
Key Stages Summary
| Stage | Method | Outcome |
|---|---|---|
| Handshake | initialize |
Protocol match (2024-11-05), capabilities shared |
| Confirmation | notifications/initialized |
Client signals readiness |
| Tool Discovery | tools/list |
Server lists 1 tool: fetch |
| Resource Discovery | resources/list |
Method not found (graceful failure) |
| Prompt Discovery | prompts/list |
Server lists 1 prompt: fetch |
This log demonstrates a successful MCP session. The fetch server adheres to the protocol, handles unsupported methods gracefully, and exposes functionality via both tools and prompts. Analyzing such logs is crucial for diagnosing issues and ensuring compatibility.
Common Issues and Debugging Techniques
1. Connection Failures & Configuration Errors
Problem: The host application fails to connect to your MCP server, or the server process fails to start correctly.
Symptoms:
- Errors like
Connection refused,Error connecting to MCP server,Server disconnected,Client transport closed unexpectedly. - The host application might hang or show no sign of the server.
- Claude Desktop/Copilot might log
Client transport closedor show the server as unavailable. - Server logs might show
connect ECONNREFUSED,EADDRINUSE: address already in use, orError: Cannot find module.
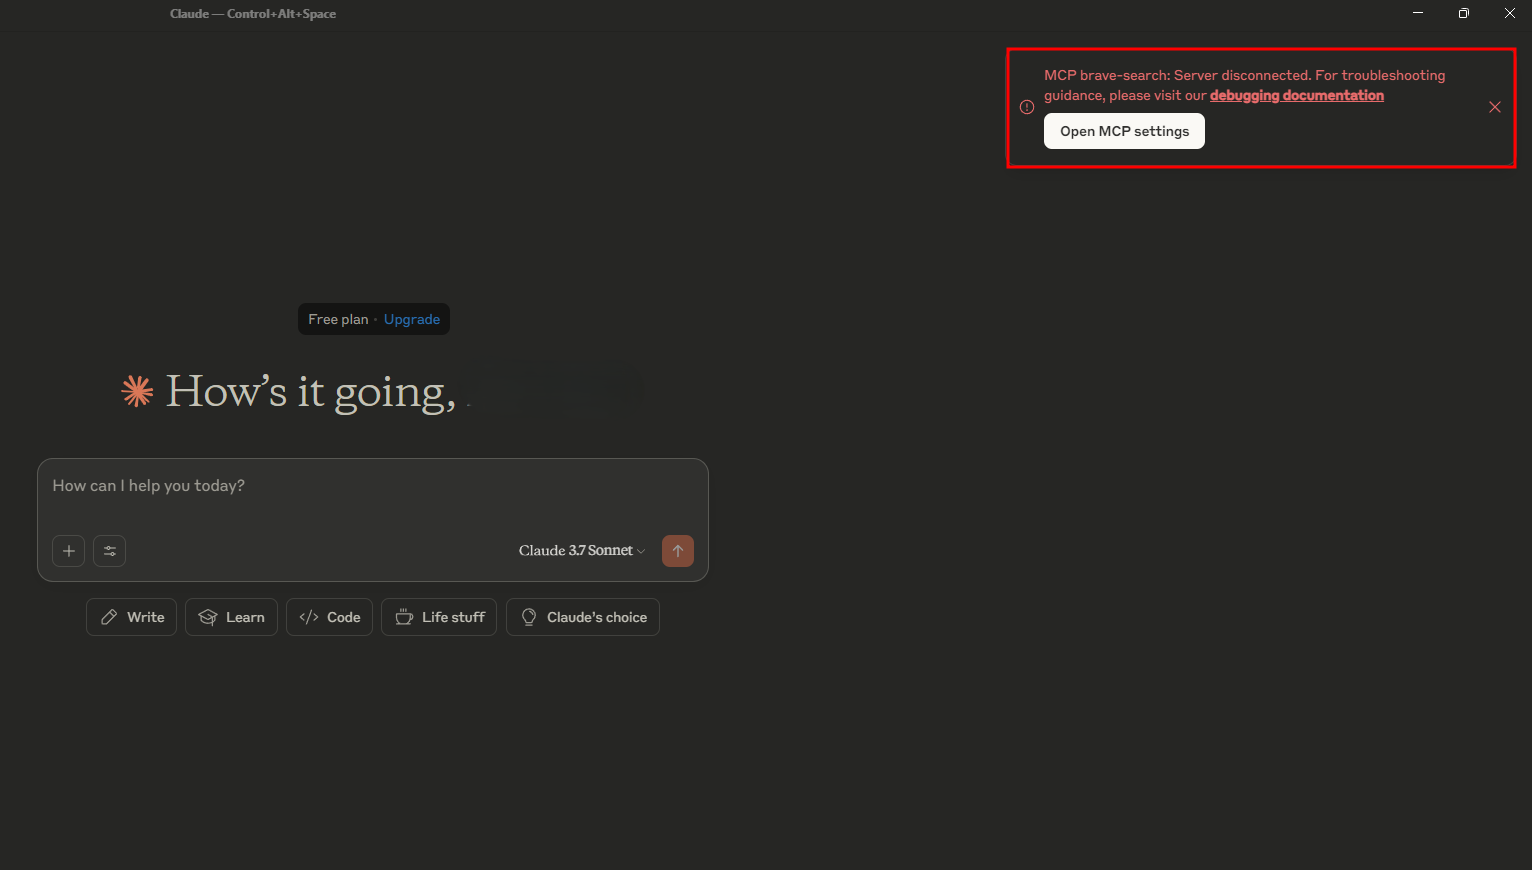 Example: Claude Desktop connection error message
Debugging Steps:
- Verify Server Process: Ensure your server script starts and stays running. Check console output for immediate crashes or errors (e.g., missing modules, incorrect syntax). Use
node server.jsormcp dev server.py(or your specific run command) directly in a terminal. - Check Transport Configuration:
- Stdio: Used by default with tools like Claude Desktop. Ensure the host is configured to launch the correct server script path. No ports involved.
- TCP/HTTP/SSE: Verify the host and server are configured with the exact same port and path (e.g.,
http://localhost:6500/mcp). Check for typos.
- Address Port Conflicts (
EADDRINUSE): If another process is using the required port, either stop the conflicting process or configure your MCP server to use a different port. Tools likenetstat(Linux/macOS/Windows) orlsof(Linux/macOS) can help identify the process using the port.- Windows:
netstat -ano | findstr :<PORT>thentaskkill /PID <PID> /F - macOS/Linux:
lsof -i :<PORT>thenkill <PID>
- Windows:
- Validate Paths and Permissions (
MODULE_NOT_FOUND,FileNotFoundError):- Ensure file paths in configurations (e.g., Claude's
mcp_servers.jsonargs) are correct and accessible. Use absolute paths or paths relative to the expected working directory. Watch out for OS differences (e.g., use forward slashes/on Windows for Node paths). - If using compiled code (like TypeScript to JavaScript), ensure the build step completed successfully (
npm run build) and the path points to the output file (e.g.,./build/main.js). - Verify execution permissions for the server script.
- Ensure file paths in configurations (e.g., Claude's
- Check Network/Firewalls: For networked transports (HTTP/SSE/TCP), ensure firewalls (local or network) are not blocking the connection on the specified port. Confirm reachability if the server is not on
localhost. - Inspect Host Logs: Monitor the host application's logs for MCP-specific messages. For Claude Desktop on macOS:
Look for handshake attempts, connection errors, or transport closure messages.tail -f ~/Library/Logs/Claude/mcp*.log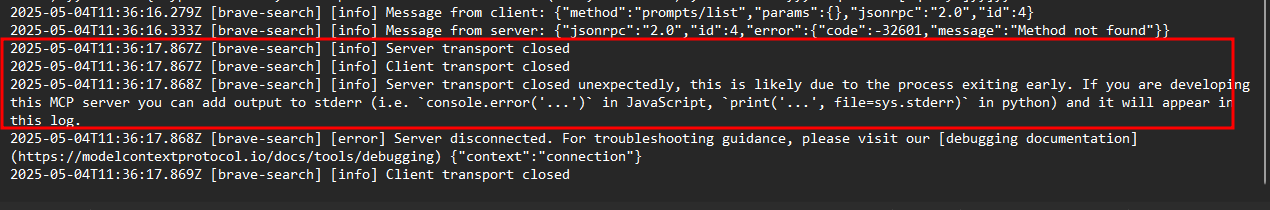 Example: Tail output of MCP logs showing errors
 - Use the MCP Inspector: The MCP Inspector tool can directly test connectivity to your server using various transports.
Example (Node.js - Stdio): A common issue is forgetting to initiate the transport connection.
// src/main.ts
import { McpServer } from "@modelcontextprotocol/sdk/server/mcp.js";
import { StdioServerTransport } from "@modelcontextprotocol/sdk/server/stdio.js";
import { z } from "zod";

const server = new McpServer({ name: "SumServer", version: "1.0.0" });

server.tool("sum", { a: z.number(), b: z.number() }, async ({ a, b }) => ({
  content: [{ type: "text", text: `Result: ${a + b}` }]
}));

// CRITICAL STEP: Connect the server to the transport
const transport = new StdioServerTransport();
await server.connect(transport); // << If this line is missing or not awaited, the server won't communicate

console.error("SumServer connected via stdio."); // Log to stderr
Mistake: If await server.connect(transport) is missing, commented out, or execution exits before this line, the host (like Claude Desktop) will connect but the server won't respond, leading to errors like Server transport closed unexpectedly or timeouts.
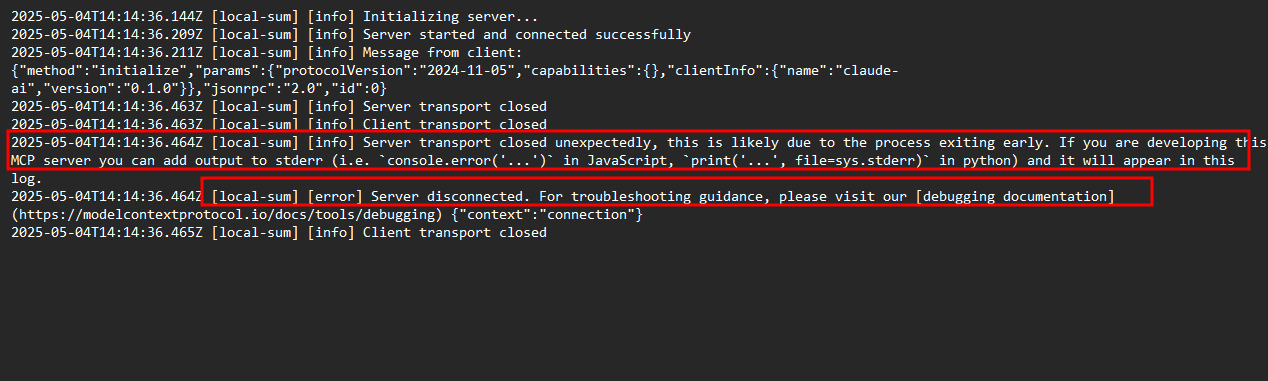 Error resulting from forgetting the connect call
Fix: Ensure server.connect() is called and properly awaited after server configuration and tool registration. Add logging (to stderr) to confirm this step is reached.
Key Takeaway: Connection issues often stem from misconfiguration (paths, ports, transport type), server startup failures, or forgetting to activate the transport listener. Systematically check each step from server launch to host configuration.
2. Invalid JSON-RPC Messages
 Invalid JSON-RPC Messages
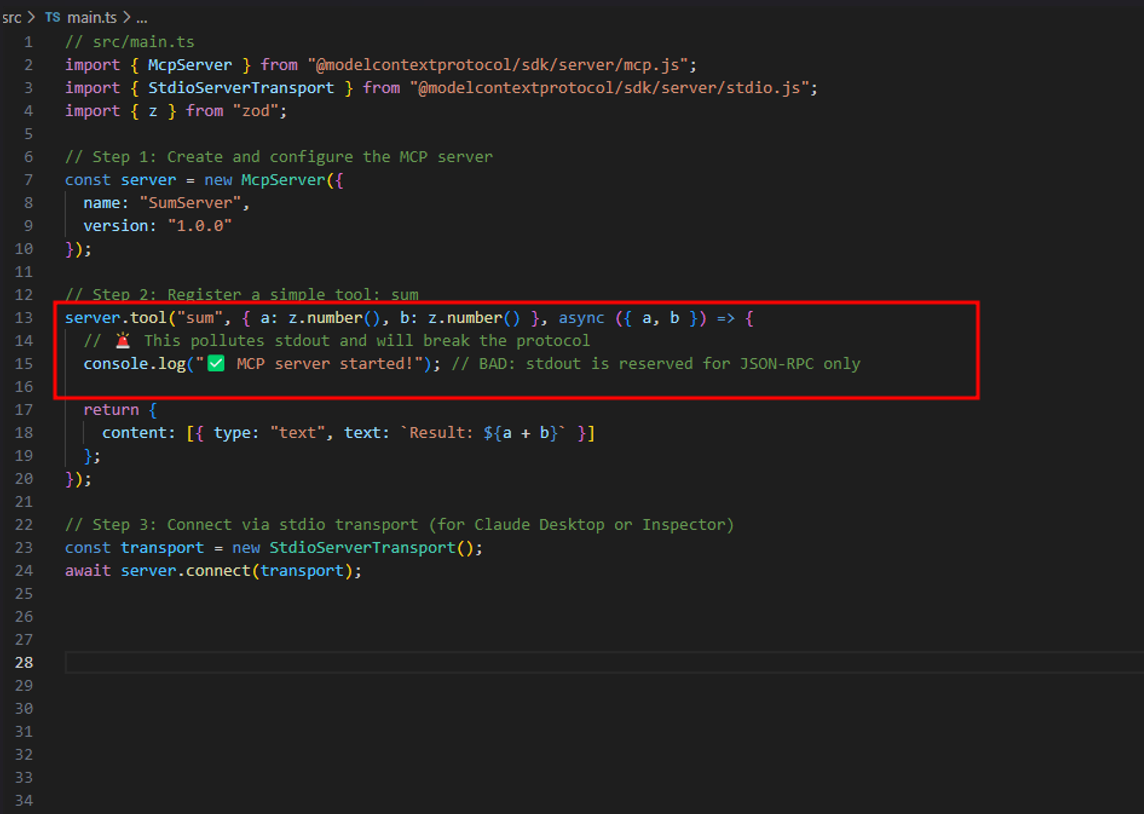
Problem: The server sends data that is not valid JSON or does not conform to the JSON-RPC 2.0 specification, or it writes non-protocol output to stdout.
Symptoms:
- Host logs errors like
Invalid JSON received,Unexpected token,Failed to parse message. - The connection might drop unexpectedly after initial success.
- Tools or resources might fail to load or execute in the host UI.
Debugging Steps
-
Isolate
stdout: The MCP protocol relies strictly onstdoutfor all JSON-RPC messages. Any non-protocol output (e.g., logs, print statements, banners) sent tostdoutwill corrupt the protocol stream.Fix: Redirect all logs and non-protocol output to
stderr.- Node.js: Use
console.error()or configure your logger to write tostderr. - Python: Use
loggingmodule methods likelogging.error()orprint(..., file=sys.stderr).
- Node.js: Use
-
Validate JSON Structure: Make sure your server emits valid JSON-RPC 2.0 messages, each including:
"jsonrpc": "2.0"- A valid
"id"(for requests/responses) - Either
"result"or"error"field (never both) Malformed JSON (e.g. trailing commas, incorrect types) will lead to client parsing errors.
-
Check Response Schemas: For methods like
tools/list,resources/list,prompts/list,getResource, andrunTool, validate that theresultmatches the MCP spec schemas exactly.- Wrong field names or missing properties will be silently rejected by the host.
- Use JSON validators or TypeScript typings (if using the MCP SDK) for stricter enforcement.
-
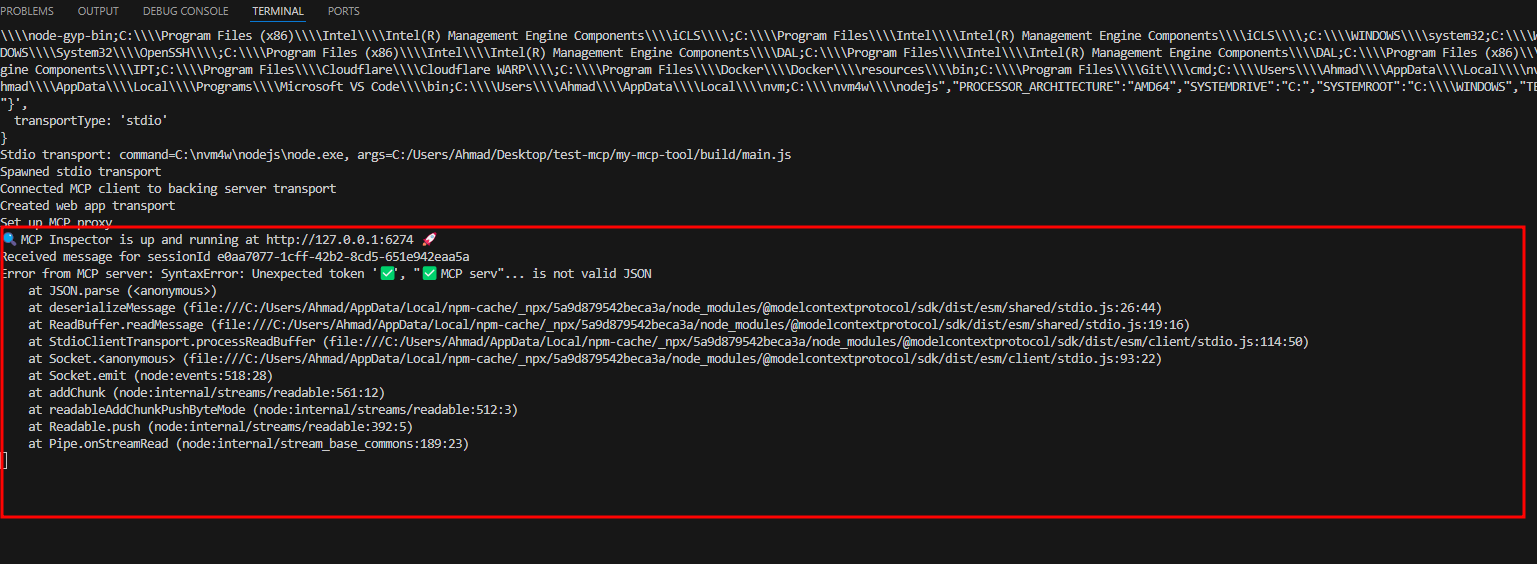
Use MCP Inspector's Console Output: MCP Inspector shows raw JSON messages and helpful protocol errors in its console and Notifications panel. This is the fastest way to:
- Catch malformed JSON
- Spot unexpected
stdoutoutput (e.g.,console.log()leaks) - Track mismatched
idfields or missingresultvalues
-
Review MCP SDK Usage: If you're using an official SDK, rely on its serialization methods to reduce manual errors.
- Double-check how you're registering tools/resources.
- Ensure returned results conform to expected schemas (e.g., arrays vs. objects, correct field names).
- Avoid modifying the SDK's output structure manually unless necessary.
3. Tool/Resource Execution Errors
Problem: A registered tool or resource handler fails during execution, potentially crashing the server or returning an incorrect response.
Symptoms:
- Host UI shows an error when trying to use a specific tool or resource.
- Server logs show exceptions or stack traces related to the handler function.
- Server process might exit unexpectedly if the error is unhandled.
- Host might receive a generic JSON-RPC error (
{"code": -32000, "message": "Server error"}) or time out.
Debugging Steps:
- Implement Robust Error Handling: Wrap the core logic inside your tool and resource handlers with
try...catch(JavaScript/TypeScript) ortry...except(Python) blocks. - Log Errors Clearly: Inside the
catch/exceptblock, log the full error details (including stack trace) tostderr. This helps pinpoint the source of the failure. - Return Proper JSON-RPC Errors: When an error occurs, construct and return a valid JSON-RPC error response object from your handler. Avoid letting exceptions propagate uncaught. The SDKs often provide helpers for this. Example error response:
{ "jsonrpc": "2.0", "id": <request_id>, "error": { "code": -32000, // Or a more specific code if applicable "message": "Failed to execute tool: <Specific reason>", "data": { "details": "...", "stack_trace": "..." } // Optional data field } } - Unit Test Handlers: Write unit tests for your tool and resource logic, mocking external dependencies (APIs, databases) to isolate functionality and verify correct behavior and error handling.
- Test with Realistic Inputs: Use the MCP Inspector or write integration tests to invoke tools/resources with various valid and invalid inputs to check edge cases and error paths.
Example (Node.js - Handling errors):
// In your McpServer setup
import { McpError, McpErrorCode } from "@modelcontextprotocol/sdk/server/mcp";
import { z } from "zod"; // Assuming zod for schema validation

server.tool("divide", { a: z.number(), b: z.number() }, async ({ a, b }) => {
  try {
    if (b === 0) {
      // Specific, handled error
      throw new Error("Division by zero is not allowed.");
    }
    const result = a / b;
    return { content: [{ type: "text", text: `Result: ${result}` }] };
  } catch (error: any) {
    console.error("Error executing 'divide' tool:", error); // Log to stderr

    // Return a structured JSON-RPC error
    throw new McpError(
      McpErrorCode.ServerError, // Generic server error code
      `Failed to execute 'divide' tool: ${error.message}`,
      { originalError: error.stack } // Optional details in 'data'
    );
  }
});
4. Protocol Version Mismatches
Problem: The client (host) and server support different or incompatible MCP protocol versions.
Symptoms:
- Connection fails during the
initializehandshake phase. - Host or server logs explicitly mention a protocol version mismatch (e.g.,
Protocol version X not supported). - The connection might drop immediately after the client sends the
initializerequest.
Debugging Steps:
- Check
initializeLogs: Examine the server and host logs for theinitializerequest and response messages. Verify theprotocolVersionfield sent by the client and the one returned by the server.- Client sends:
{"method":"initialize","params":{"protocolVersion":"YYYY-MM-DD", ...}} - Server responds:
{"result":{"protocolVersion":"YYYY-MM-DD", ...}}
- Client sends:
- Verify SDK Versions: Ensure you are using versions of the MCP SDK (Node.js/Python) that support the protocol version required by the host application you are targeting. Consult the host's documentation (e.g., Claude Desktop, Copilot Studio) for their currently supported MCP version.
- Update SDKs: If there's a mismatch, update your server's MCP SDK to a compatible version.
- Server Version Negotiation Logic: If your server needs to support multiple protocol versions, ensure its
initializehandler correctly implements negotiation logic according to the MCP specification (typically, supporting the latest version requested by the client that the server also supports). The SDKs usually handle this automatically if configured correctly.
Logging and Observability Best Practices
Effective logging is crucial for diagnosing MCP issues:
- Use
stderrfor Logs: Critically important: All diagnostic logs, debug messages, and any non-protocol output must be written tostderr. MCP communication usesstdoutexclusively. Outputting anything else tostdoutwill break the protocol parsing on the client side. Useconsole.error(Node),loggingto stderr (Python), orprint(..., file=sys.stderr)(Python). - Include Context: Prefix logs with identifiers like the server name, tool/resource being handled, or request ID (if available). Example:
console.error("[MyFileServer] [getResource] Error reading file:", err);. - Structured Logging: Consider using JSON format for logs, especially in production. This allows easier parsing and querying by log aggregation systems. Include fields like
timestamp,level,serverName,method,requestId,message,errorStack. - Monitor Host Logs: Always check the logs generated by the host application (Claude, Copilot, etc.). These often provide the client-side perspective of the communication, including connection attempts and parsing errors.
- Trace Message Flow: Use detailed logging (on
stderr) to trace the lifecycle of a request: reception (initialize,getResource,runTool), processing start, key internal steps, potential errors, and response sending. This helps identify where processing hangs or fails. - Implement Global Error Catching: In Node.js, use
process.on('uncaughtException', ...)andprocess.on('unhandledRejection', ...)to catch unexpected errors. In Python'sasyncio, useloop.set_exception_handler(...). Log these errors thoroughly before potentially exiting. - Leverage MCP Inspector: The Inspector displays server logs (from
stderr) in real-time, making it easy to correlate server activity with test requests.
SDK-Specific Debugging Tools
The official MCP SDKs provide tools to streamline development and debugging:
-
- A cross-platform GUI/web tool for testing any MCP server (Node.js, Python, etc.).
- Launch it via
npx @modelcontextprotocol/inspector(requires Node.js installed). - Allows you to connect to your server via various transports (stdio, HTTP, TCP), send test requests to tools/resources, view responses, and inspect server logs (
stderr) and notifications in real-time. - Can proxy the launch of your server:
npx @modelcontextprotocol/inspector node dist/server.jsornpx @modelcontextprotocol/inspector python server.py. - Indispensable for interactive debugging and verifying protocol conformance.
-
- Installed via
pip install "mcp[cli]". mcp install server.py: Registers your Python server script with Claude Desktop automatically (updatesmcp_servers.json).mcp dev server.py: Runs your Python server script under the MCP Inspector for easy testing. Supports passing arguments or environment variables.mcp start server.py: Runs the server standalone using stdio transport.- Simplifies the development loop for Python-based servers, especially when targeting Claude Desktop.
- Installed via
-
Node.js/TypeScript SDK:
- While there's no dedicated CLI like Python's, you can use standard Node.js debugging tools (
node --inspect, VS Code debugger). - Leverage the MCP Inspector (
npx @modelcontextprotocol/inspector node your-script.js) for interactive testing. - Use TypeScript's static typing to catch errors early. Ensure your
tsconfig.jsonis correctly configured (e.g., include"types": ["node"], set appropriatemodule,target). Install@types/nodeif needed (npm install --save-dev @types/node).
- While there's no dedicated CLI like Python's, you can use standard Node.js debugging tools (
-
Host Developer Tools:
- Claude Desktop: Check the "Connected Servers" status in the UI. Enable DevTools via
developer_settings.json("allowDevTools": true) to inspect client-side behavior and potential errors within Claude itself. - Copilot Studio: Offers debugging views showing MCP request/response logs and connection status.
- Utilize these host-specific tools to understand how the client perceives your server.
- Claude Desktop: Check the "Connected Servers" status in the UI. Enable DevTools via
Summary of Debugging Tips
- Check Connections First: For connection errors (
ECONNREFUSED,disconnected), verify the server process is running, the transport (stdio path, HTTP port/address) is correct in both server code and host config, and no port conflicts (EADDRINUSE) exist. Check paths and permissions. - Validate JSON &
stdout: For parsing errors (Unexpected token), ensure only valid JSON-RPC messages are written tostdout. All logs/debug output must go tostderr. Use the MCP Inspector to view raw messages. - Log Effectively: Use structured logs directed to
stderr. Include context (server name, method, request ID). Tail server and host logs simultaneously during testing. - Leverage SDK Tools: Use the MCP Inspector for interactive testing of any server. Use the Python
mcpCLI (dev,install) for streamlining Python development. - Handle Errors Gracefully: Wrap tool/resource logic in
try/catchblocks. Log errors tostderrwith details. Return valid JSON-RPC error responses instead of crashing. - Align Protocol Versions: Ensure your server's SDK supports the protocol version expected by the host. Check
initializemessage logs for negotiation details. - Test Systematically: Use unit tests for logic and integration tests (via Inspector or scripts) to simulate host interactions, covering success and failure paths for all tools/resources.
By applying these techniques and utilizing the available tools like the MCP Inspector, you can systematically identify and resolve issues in your MCP server implementations. Visibility into the communication flow (via logs and Inspector) and robust error handling within your server code are key to building reliable MCP integrations.