MCP Monitoring
Comprehensive monitoring and observability for your MCP servers with our real-time dashboard.
MCP Monitoring made easy
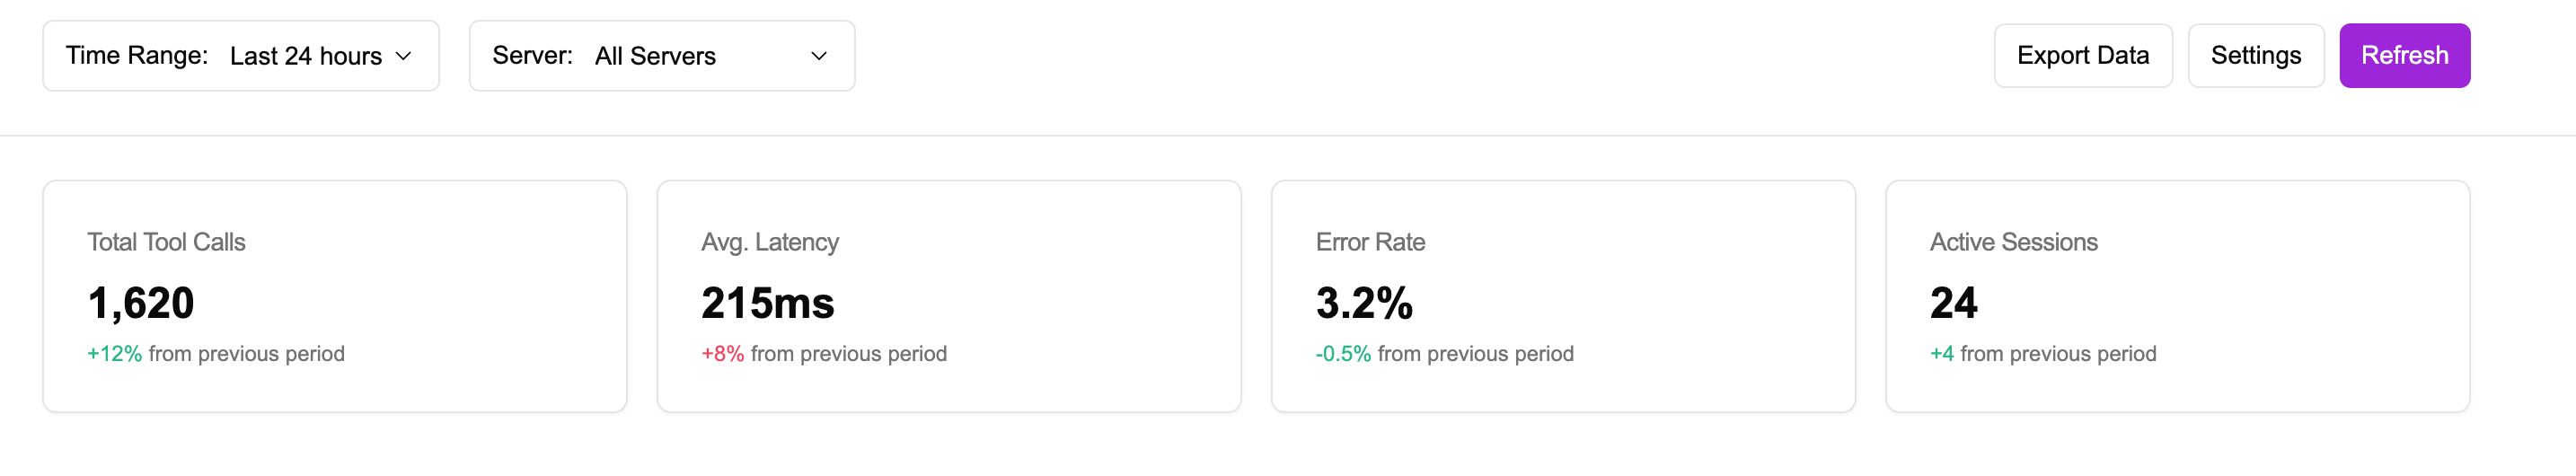
The MCP Monitoring Dashboard provides comprehensive visibility into your Model Context Protocol implementations, helping you track performance, identify issues, and optimize tool usage.
Track call volume and distribution across different tool types to identify usage patterns and optimize resources.
Monitor latency and response times across different tools to identify bottlenecks and improve user experience.
Identify and troubleshoot issues with real-time error monitoring and status tracking.
Analyze sequences of tool calls to understand dependencies and optimize workflows.
Filter data by time range and server type to focus on the metrics that matter most to you.
Interact with charts and tables to drill down into specific metrics and gain deeper insights.
Dashboard Features
Explore the powerful features available in the MCP Observatory Dashboard that help you gain insights into your MCP implementations.
Tool Call Monitoring
The dashboard provides a comprehensive view of tool call activity over time, helping you understand usage patterns and resource allocation needs.
Volume Tracking
Monitor the total number of tool calls over time with detailed breakdowns by type.
- Visualize call volume over custom time periods
- Track trends with automatic peak detection
- Filter data to focus on specific tool types
Distribution Analysis
Understand how your tool usage is distributed across different categories.
- Interactive pie chart for proportion visualization
- Compare File System, Database, API, and Web Search usage
- Identify resource allocation opportunities
Pattern Recognition
Identify usage patterns to optimize your MCP implementation and plan capacity.
- Historical trend analysis over time
- Usage spike identification and impact assessment
- Forecast future capacity needs